2020. 9. 1. 19:42ㆍLearning archive/Data Science
📌 Gapminder World Map

📌 How to use Matplotlib

plot function tells python what to show, how to show!
📌Scatter plot : doesn't connect the dots, more honest way

📌Practice : 나의 첫 그래프


Histogram
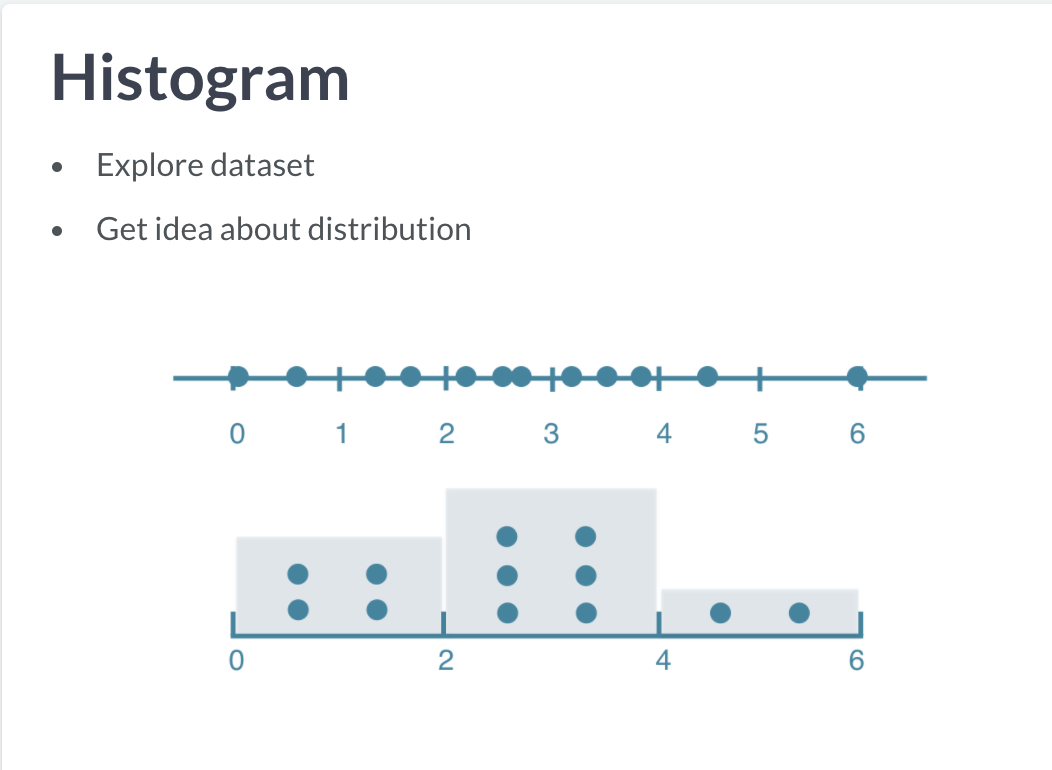
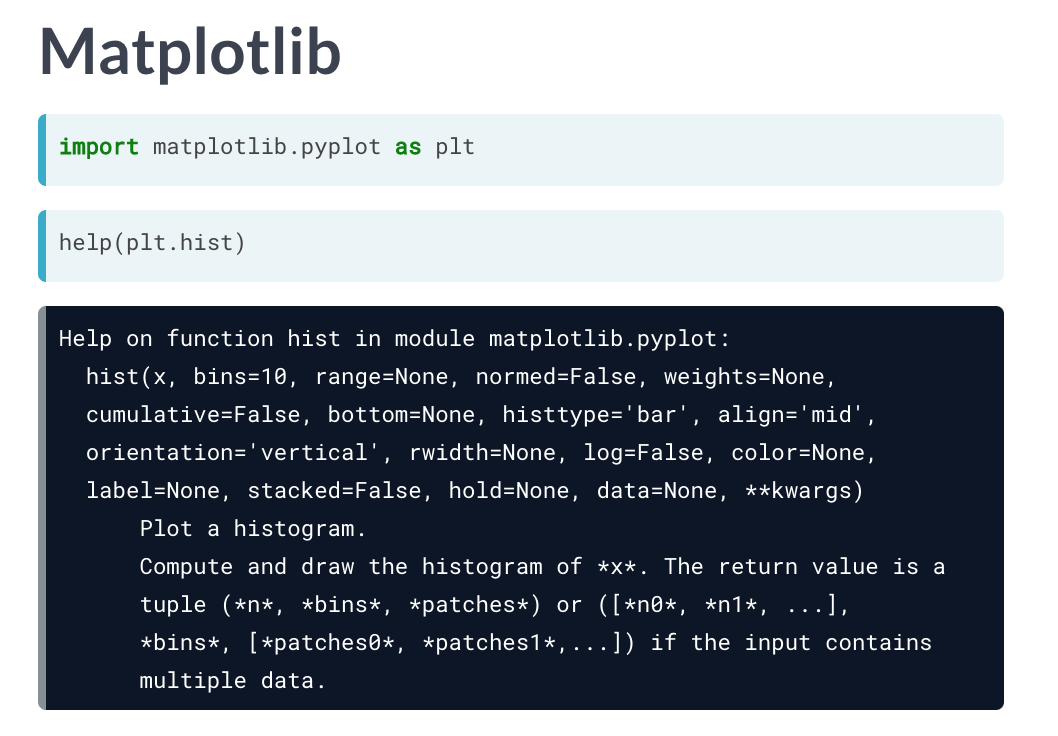

e.g. population pyramid :

Histogram_practice
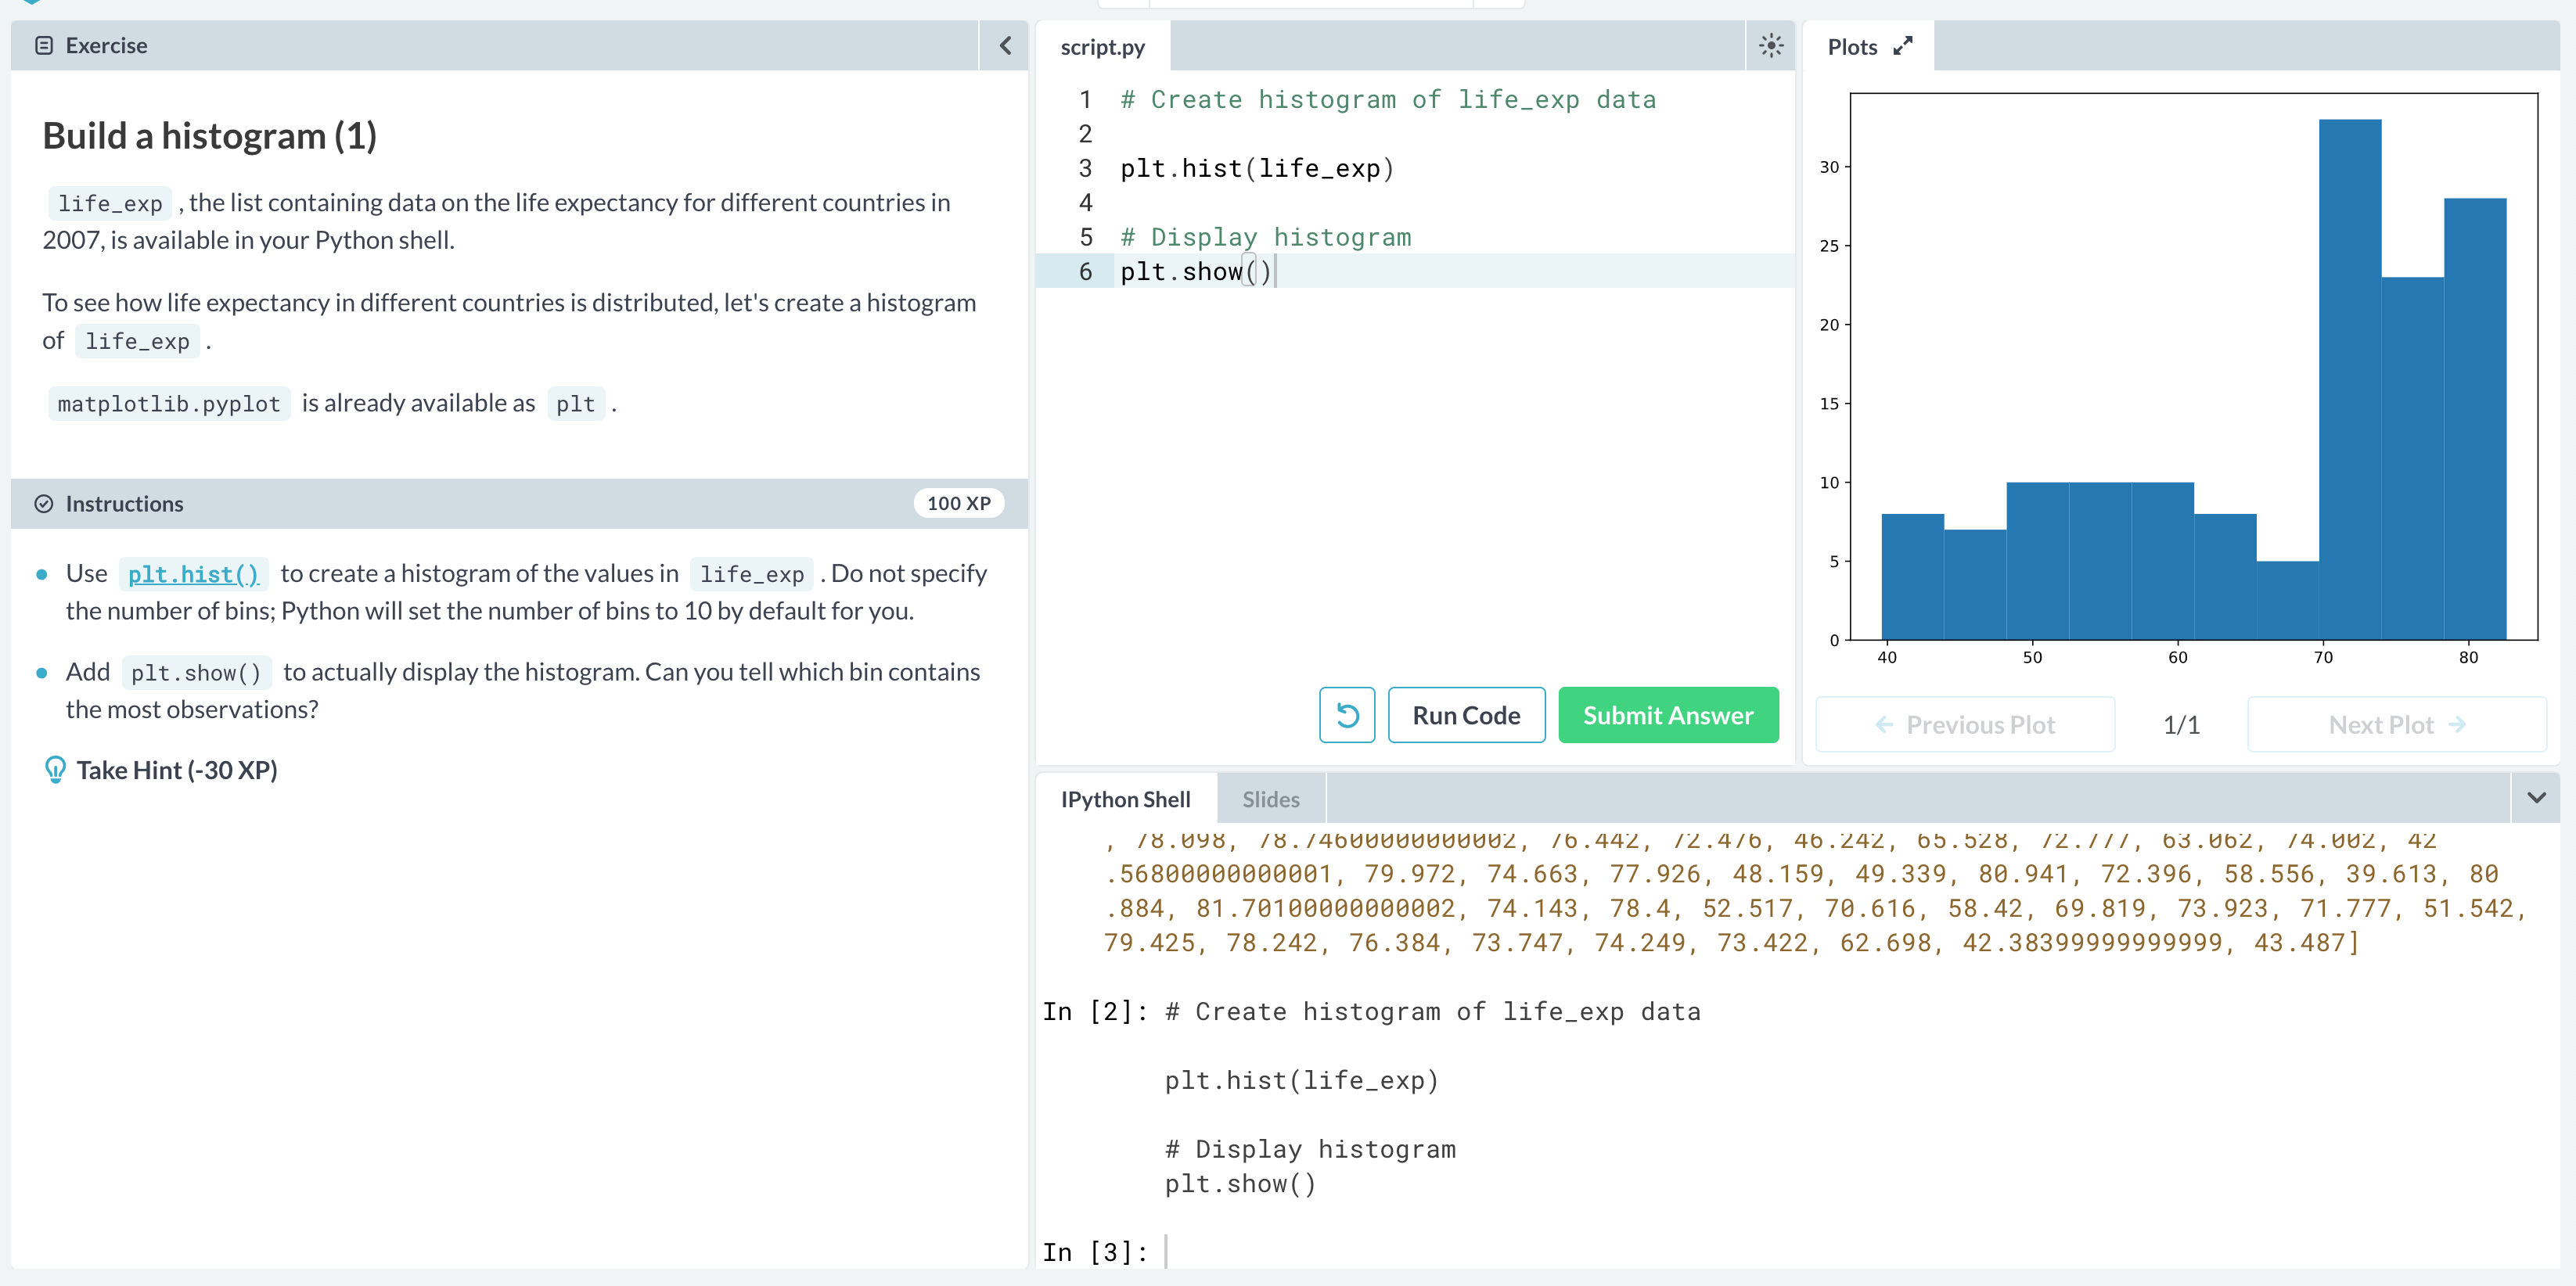
Build a histogram(3) : compare


customizaiton : how to customize plots

different plot types * (colors, shapes, .. etc. ) customizations * Data * story
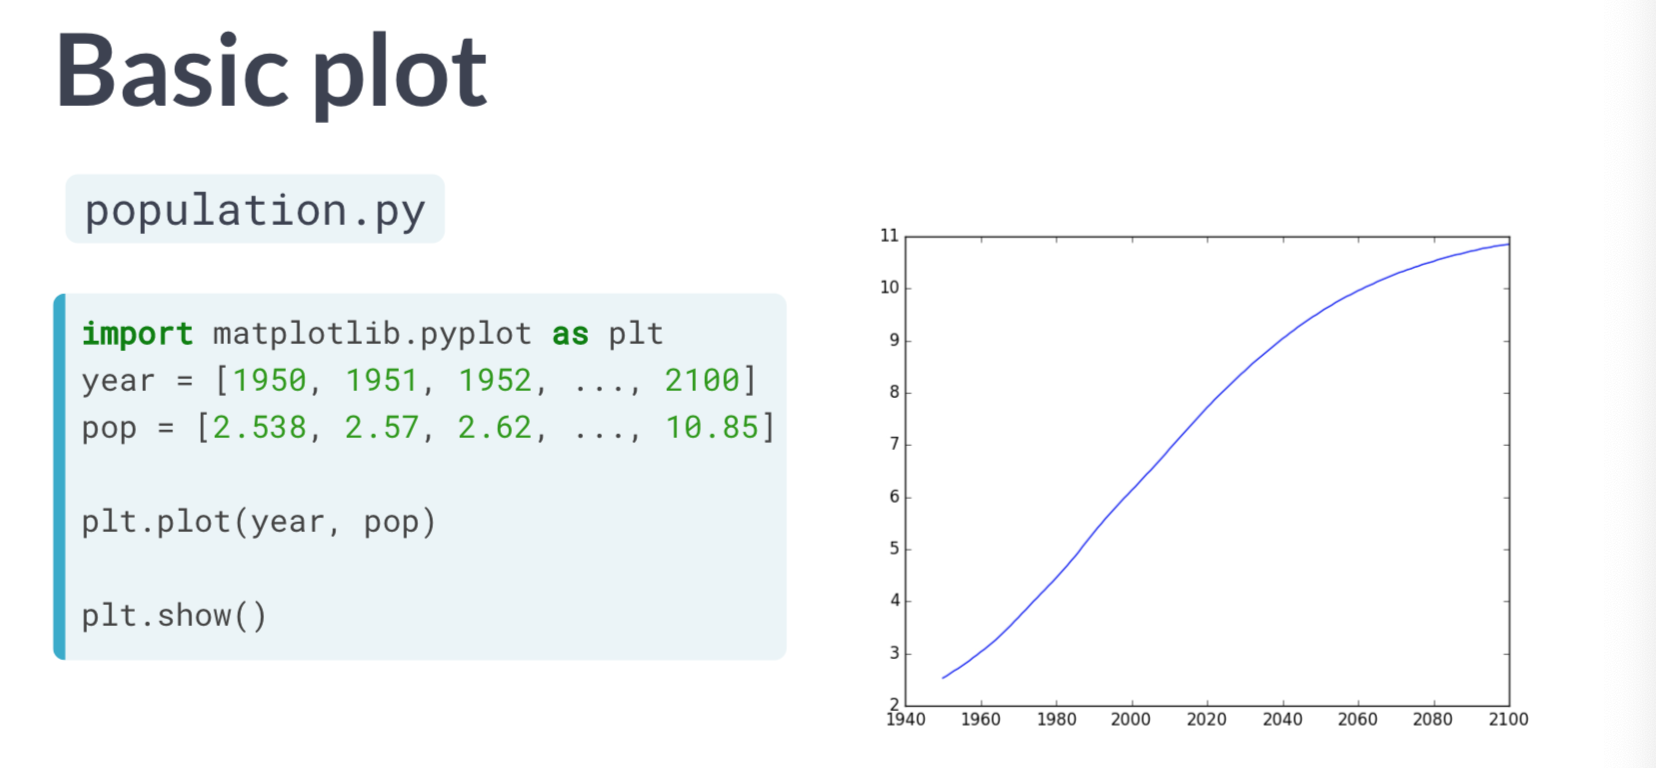
+ add axis labels


Labels


New python type : Dictionaries (so useful!)

기존의 방식 : 2개의 리스트를 만든다. 인덱스로 두 리스트를 연결한다. not convenient, not intuitive
Dictionary의 방식
pop = [30, 2, 39]
countries = ["afg", "alba", "algeria"]
...
world = {"afg":30, "alba":2, "algeria":39}
world[alba]
// intuitive, more efficient (more speed)
Dictionary Manipulation(1) add keys

📌 Pandas, Part1
Tabular data set examples
row = observations 관측개체
col = variable = 변수

📌 pandas = high level data manipulation tool (built on Numpy)

you can build it manually #1 : from dict using pd.DataFrame(dictname)

#2 Dataframe from CSV file

- CSV파일은 comma-separated values의 약자로, 데이터를 저장하고 공유하는 매우 간편한 포맷이다,
- CSV파일은 숫자나 문자열로 구성된 표를 일반 텍스트(plain text)로 저장하므로, 이를 저장, 전송, 처리 할 수 있는 프로그램이 다양하다.
- 데이터 저장소(csv file)와 데이터 처리(python 스크립트가 분리되므로, 다른 데이터셋에 똑같은 처리 과정을 보다 쉽게 적용할 수 있다.
index_col=0

practice
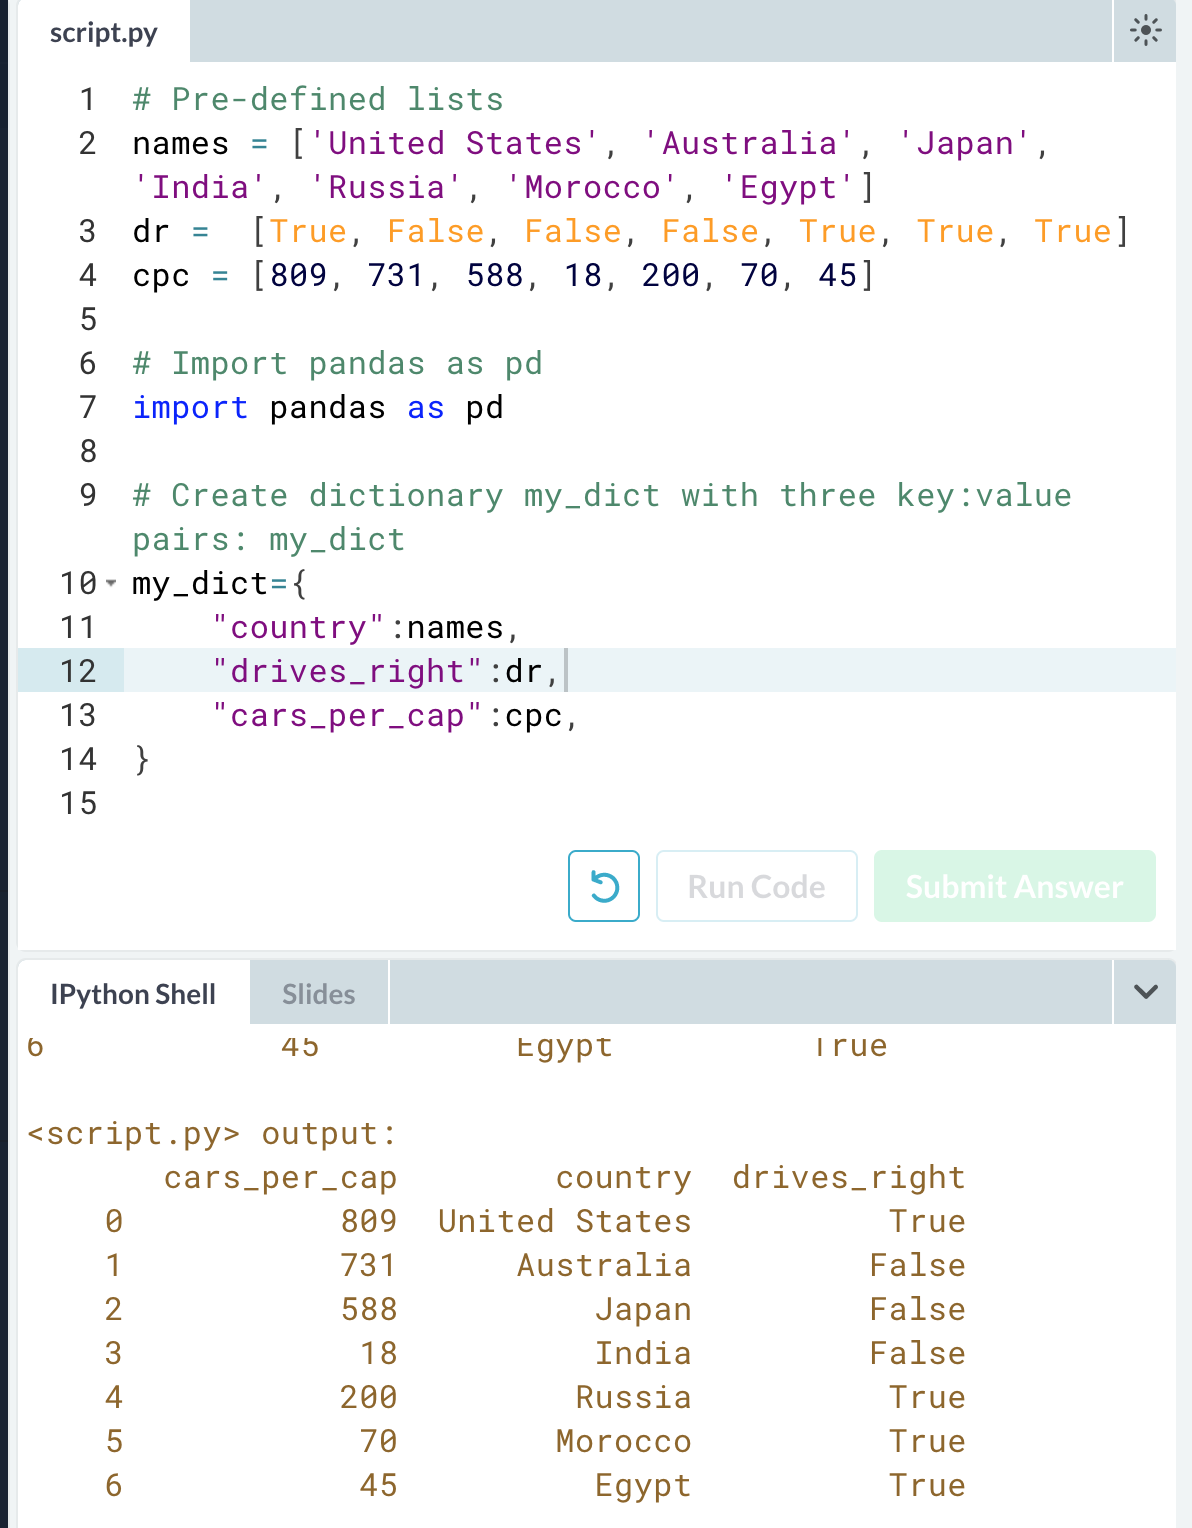
dictionary로 dataframe 실행시키고, 행에 label붙이기

CSV to Dataframe(1)
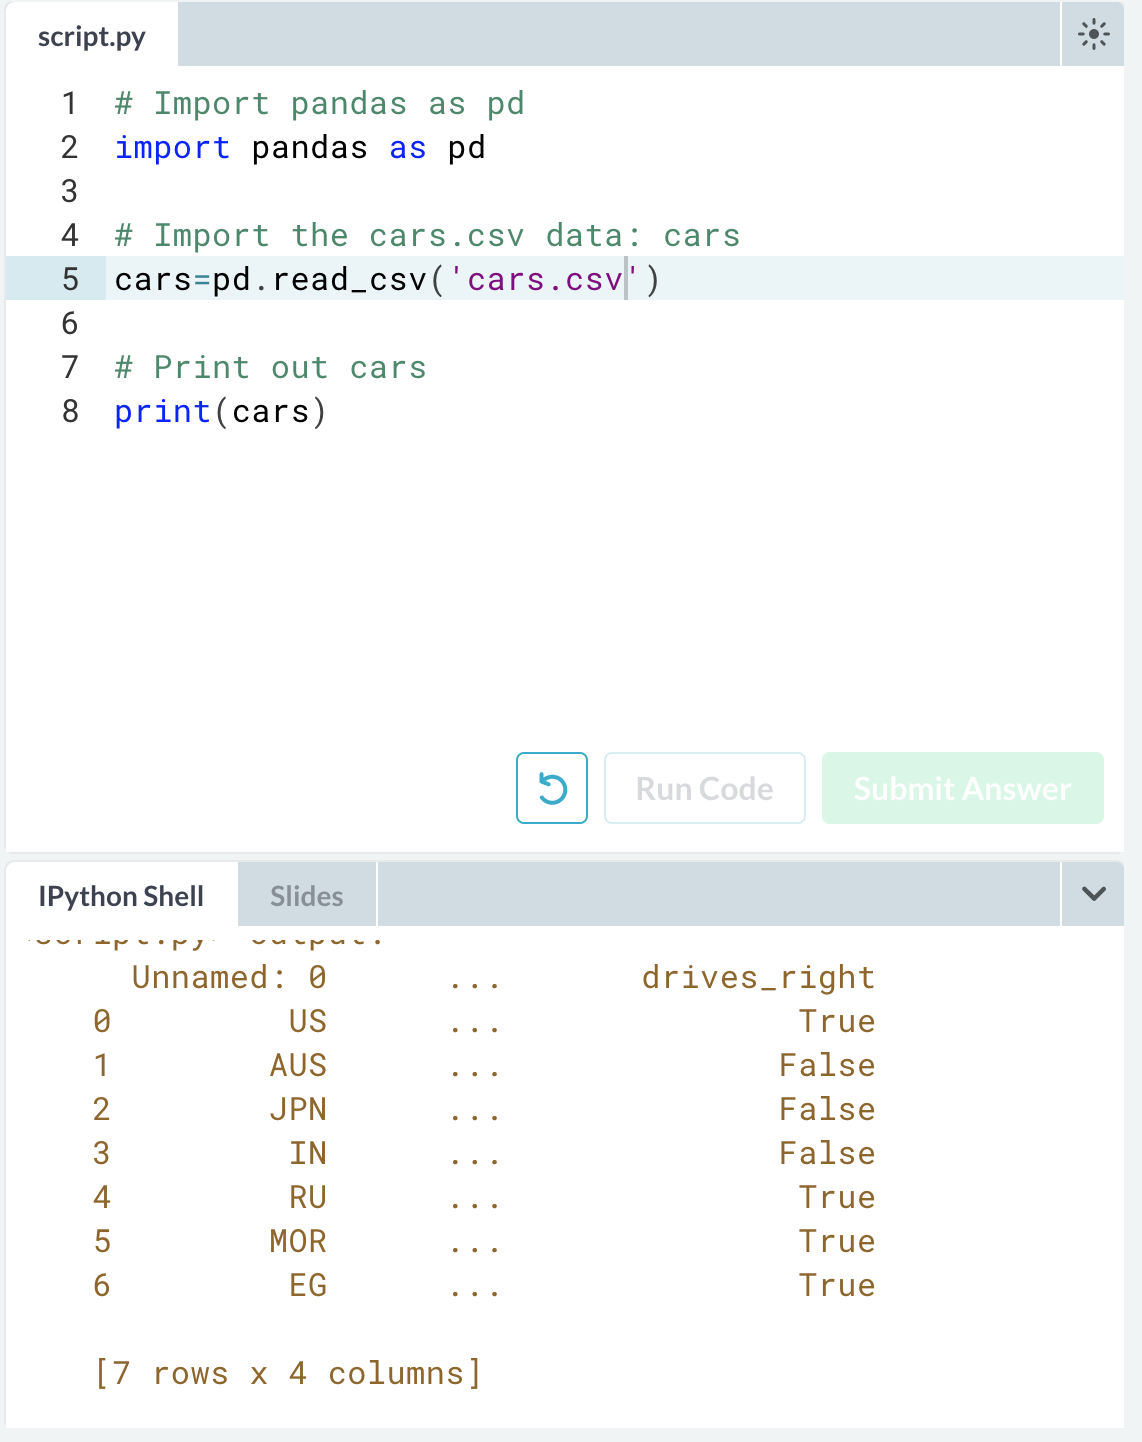
pandas 호출, csv 불러오고, index_col=0

Pandas part2

📌 Index and selet data! : first, with []
In the video, you saw that you can index and select Pandas DataFrames in many different ways. The simplest, but not the most powerful way, is to use square brackets.


2 Column 도 ok []

Row Access []

but [] : limited functionality
Pandas loc와 iloc을 사용해보자

loc (label-based)


difference here = you can extend ur sellection with your commas, +


loc(label-based)
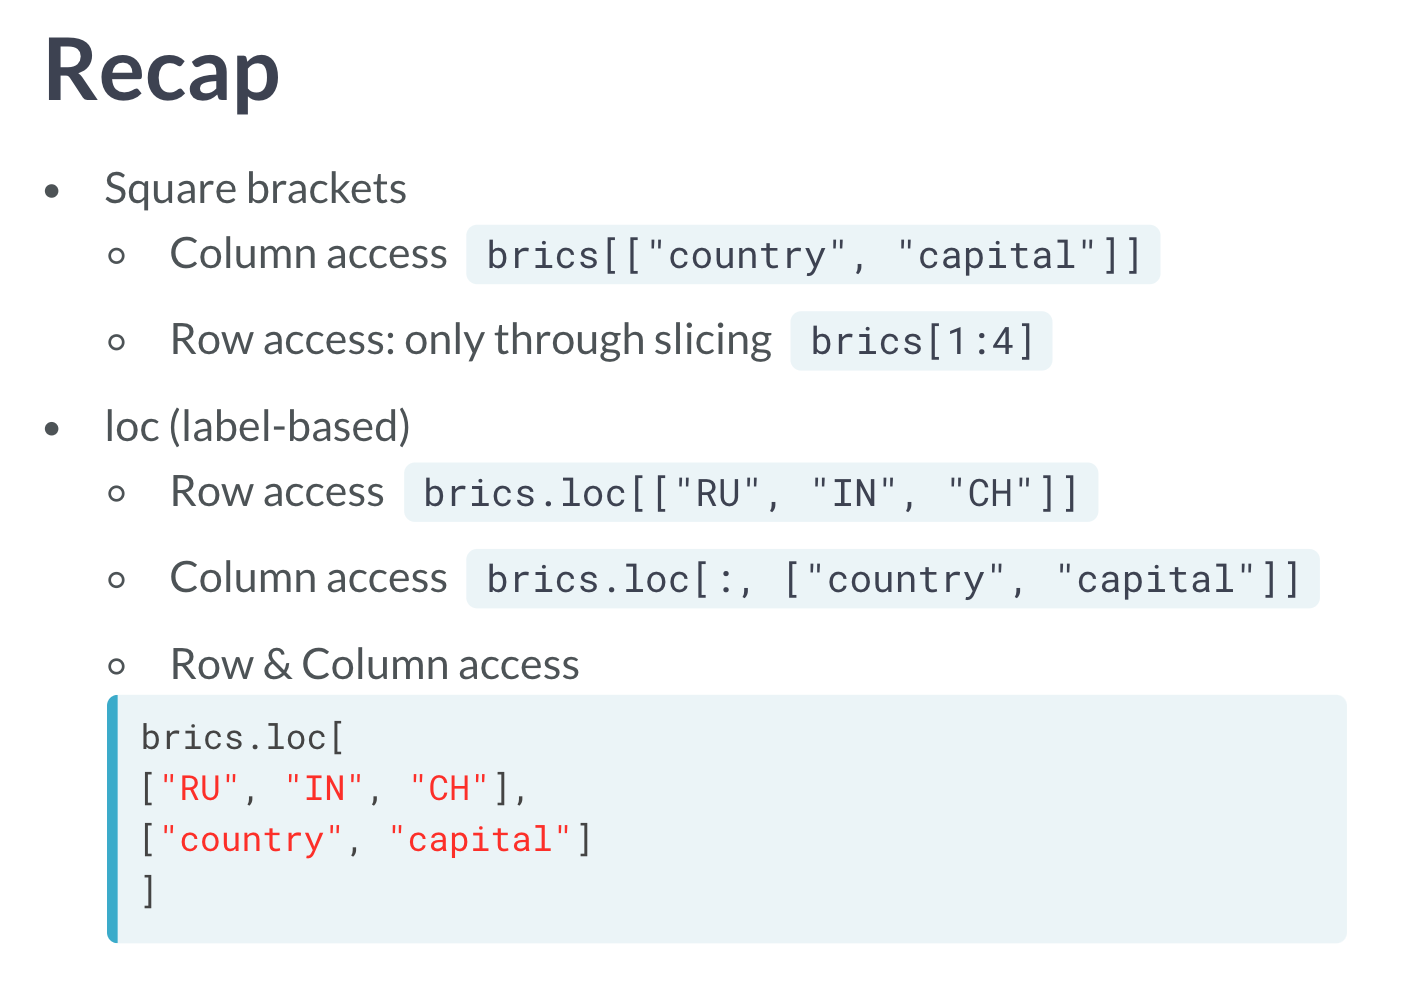
Row Acces iloc : can use index


loc vs iloc
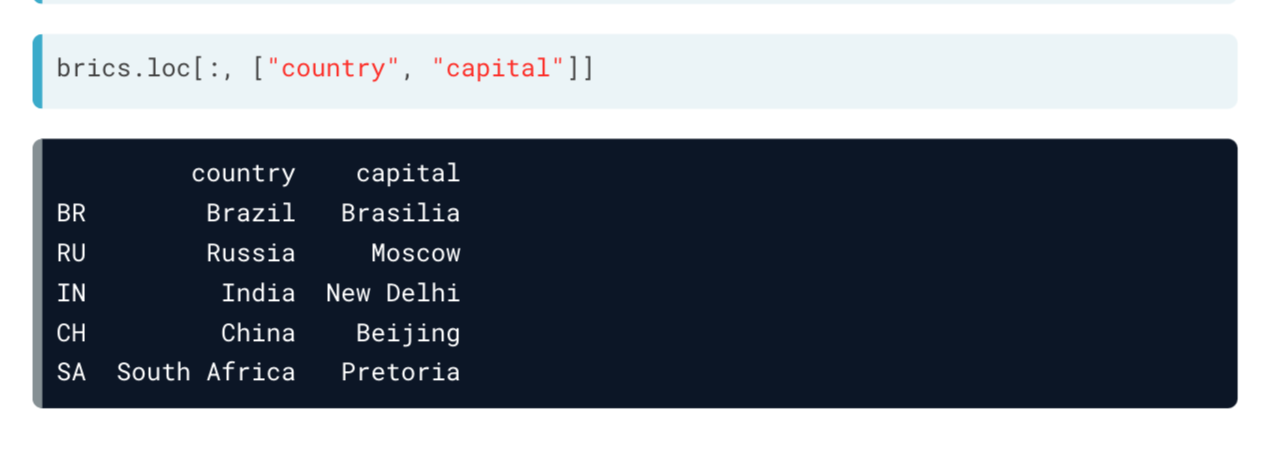

Practice!


출처
datacamp.com
'Learning archive > Data Science' 카테고리의 다른 글
| 📊[DataCamp] Intermediate Python : Distribution (0) | 2020.09.02 |
|---|---|
| 📊[DataCamp] Conditional statement : if, elif, else / Filtering pandas DataFrames / while loop / Loop Data Structures (0) | 2020.09.02 |
| [기초통계학 3강] 기술통계-수치적 해석 (0) | 2020.08.31 |
| [기초통계학 2강] 기술통계(Descriptive Statistics) (0) | 2020.08.30 |
| [기초통계학 1강] 모집단과 표본 (0) | 2020.08.30 |