2020. 9. 10. 18:16ㆍLearning archive/Data Science
📌데이터 시각화, Matplotlib
데이터 시각화는 데이터 분석 과정에서 매우 중요한 부분이다. 프로젝트 초기 단계 또는 리포팅 단계에서 탐색적 데이터 분석(EDA)의 일환으로서, 결과를 다른 사람과 공유할 때 유용하다. 또한 데이터를 시각화하면 변수 값의 분포나 변수 사이의 관계를 확인하고 모델링을 위한 가설을 도출하는 데에도 도움이 된다.
Matplotlib은 고품질의 그래프를 만들기 위한 목적의 패키지이다. 막대 그래프, 상자그림, 선 그래프, 산점도, 히스토그램 등 기본적인 통계 그래프를 만들 수 있고, 데이터를 지도에 매핑하는 basemap 및 cartopy, 그리고 3D 그래프를 만드는 mplot3d같은 도구도 제공한다.
출처 : <파이썬 데이터 분석 입문> 279p.
Adding data to axes : plotting command


Customizing plots
- Customizing data ppearance (adding markers
마커 확인하는 곳 : matplotlib.org/api/markers_api.html
matplotlib.markers — Matplotlib 3.3.1 documentation
matplotlib.markers Functions to handle markers; used by the marker functionality of plot and scatter. All possible markers are defined here: marker symbol description "." point "," pixel "o" circle "v" triangle_down "^" triangle_up "<" triangle_left ">" tr
matplotlib.org
📌 Setting : marker, linestyle, and color

📌마커, 라인스타일, 컬러 지정하기 예제 (Customizing the axes labels)

📌 x축과 y축에 라벨 달기

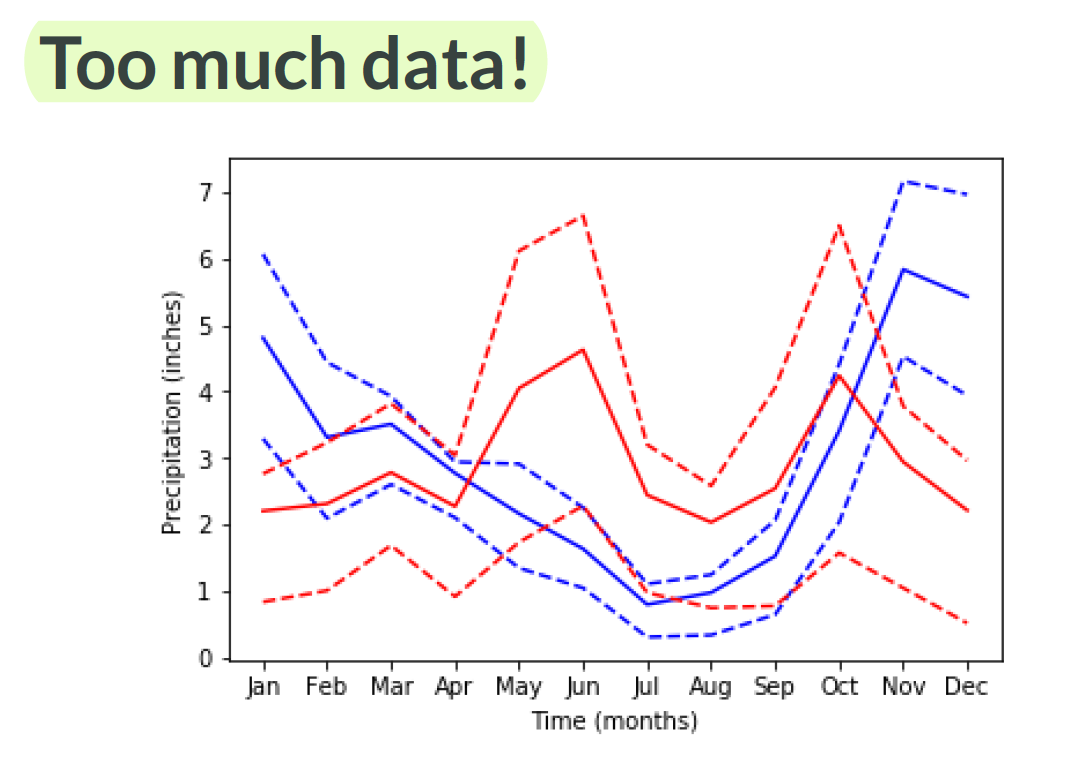
📌 Small multiples : 작은 plot을 여러개 만들자!

//small multiples with plt.subplots
fig, ax = plt.subplots()


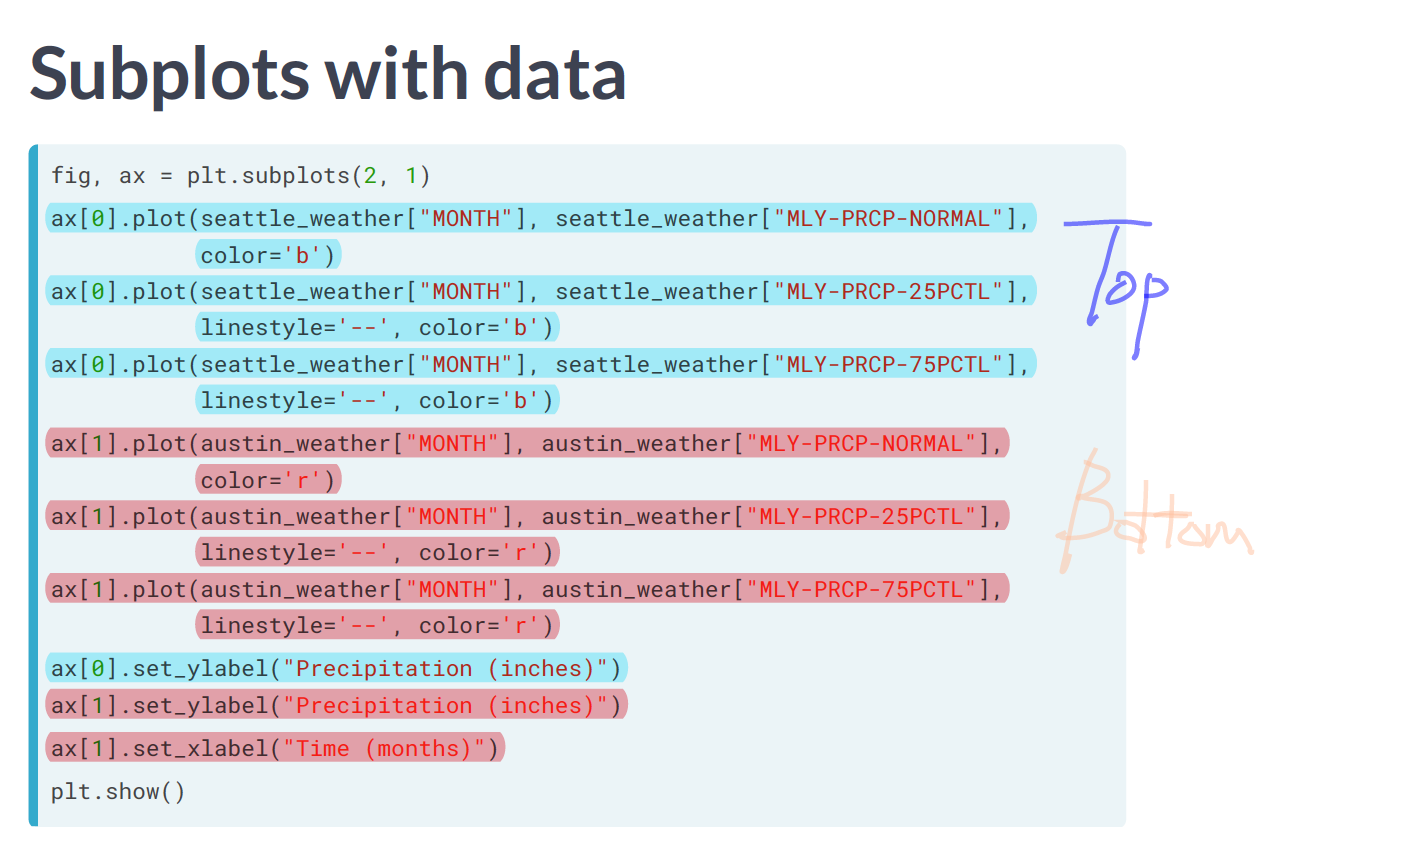
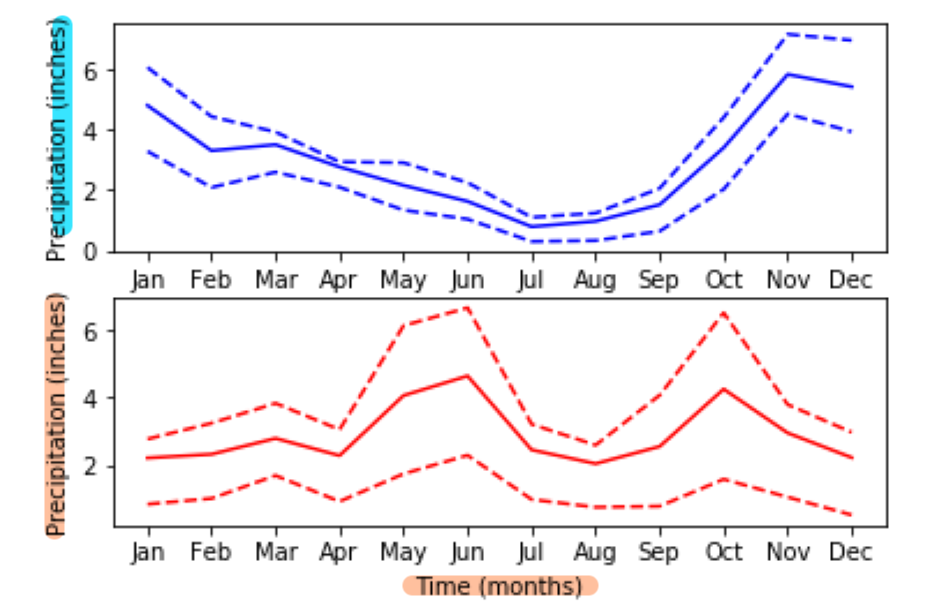
📌 예제 : Small multiples


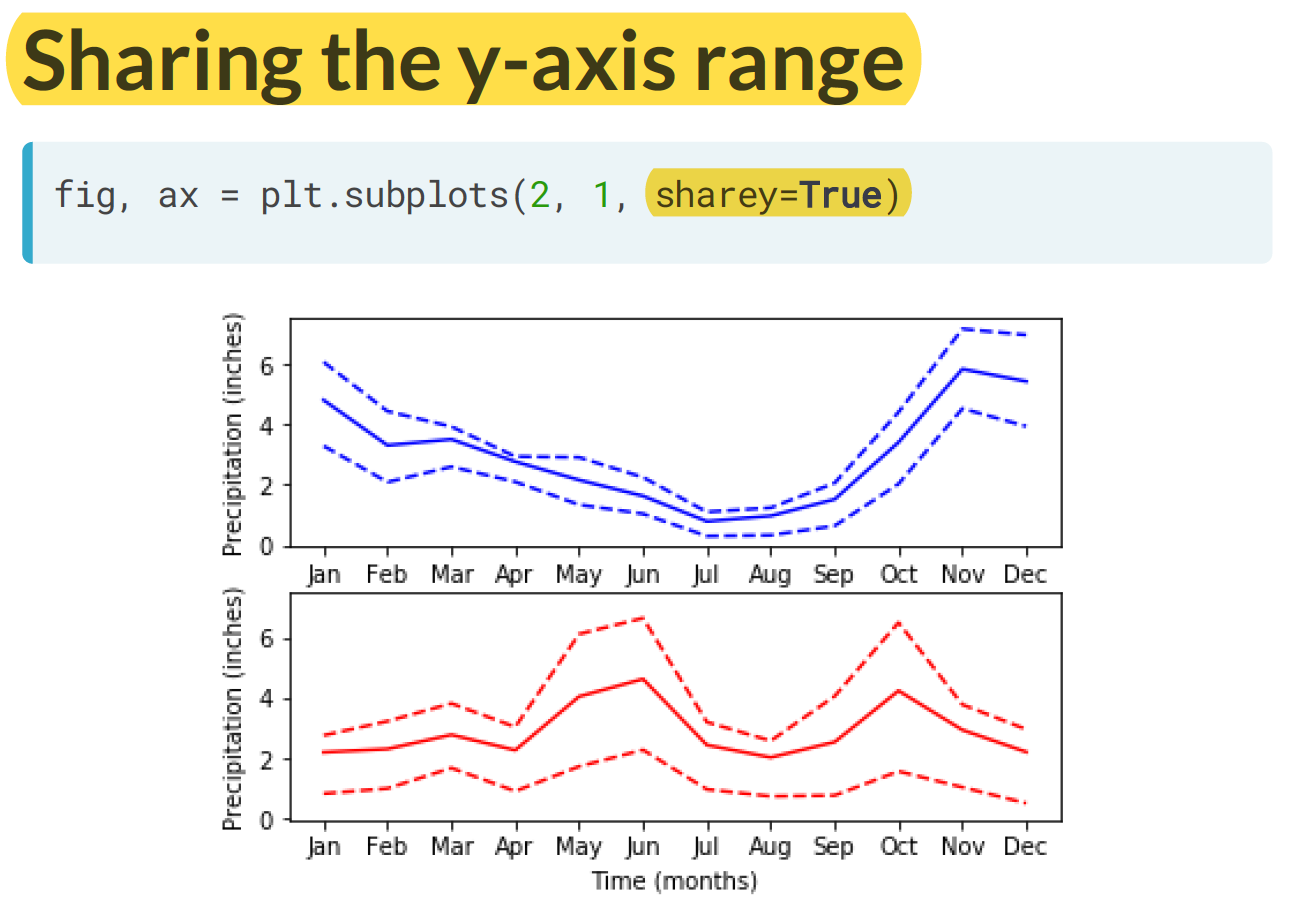
📌 sharey=True : y축을 동일하게 설정하자


출처 : www.datacamp.com
Learn R, Python & Data Science Online
Learn Data Science from the comfort of your browser, at your own pace with DataCamp's video tutorials & coding challenges on R, Python, Statistics & more.
www.datacamp.com