📊Matplotlib 시계열 데이터 시각화 기초 Plotting time-series data
2020. 9. 12. 10:27ㆍLearning archive/Data Science
Image credits : datacamp.com
CONTENTS
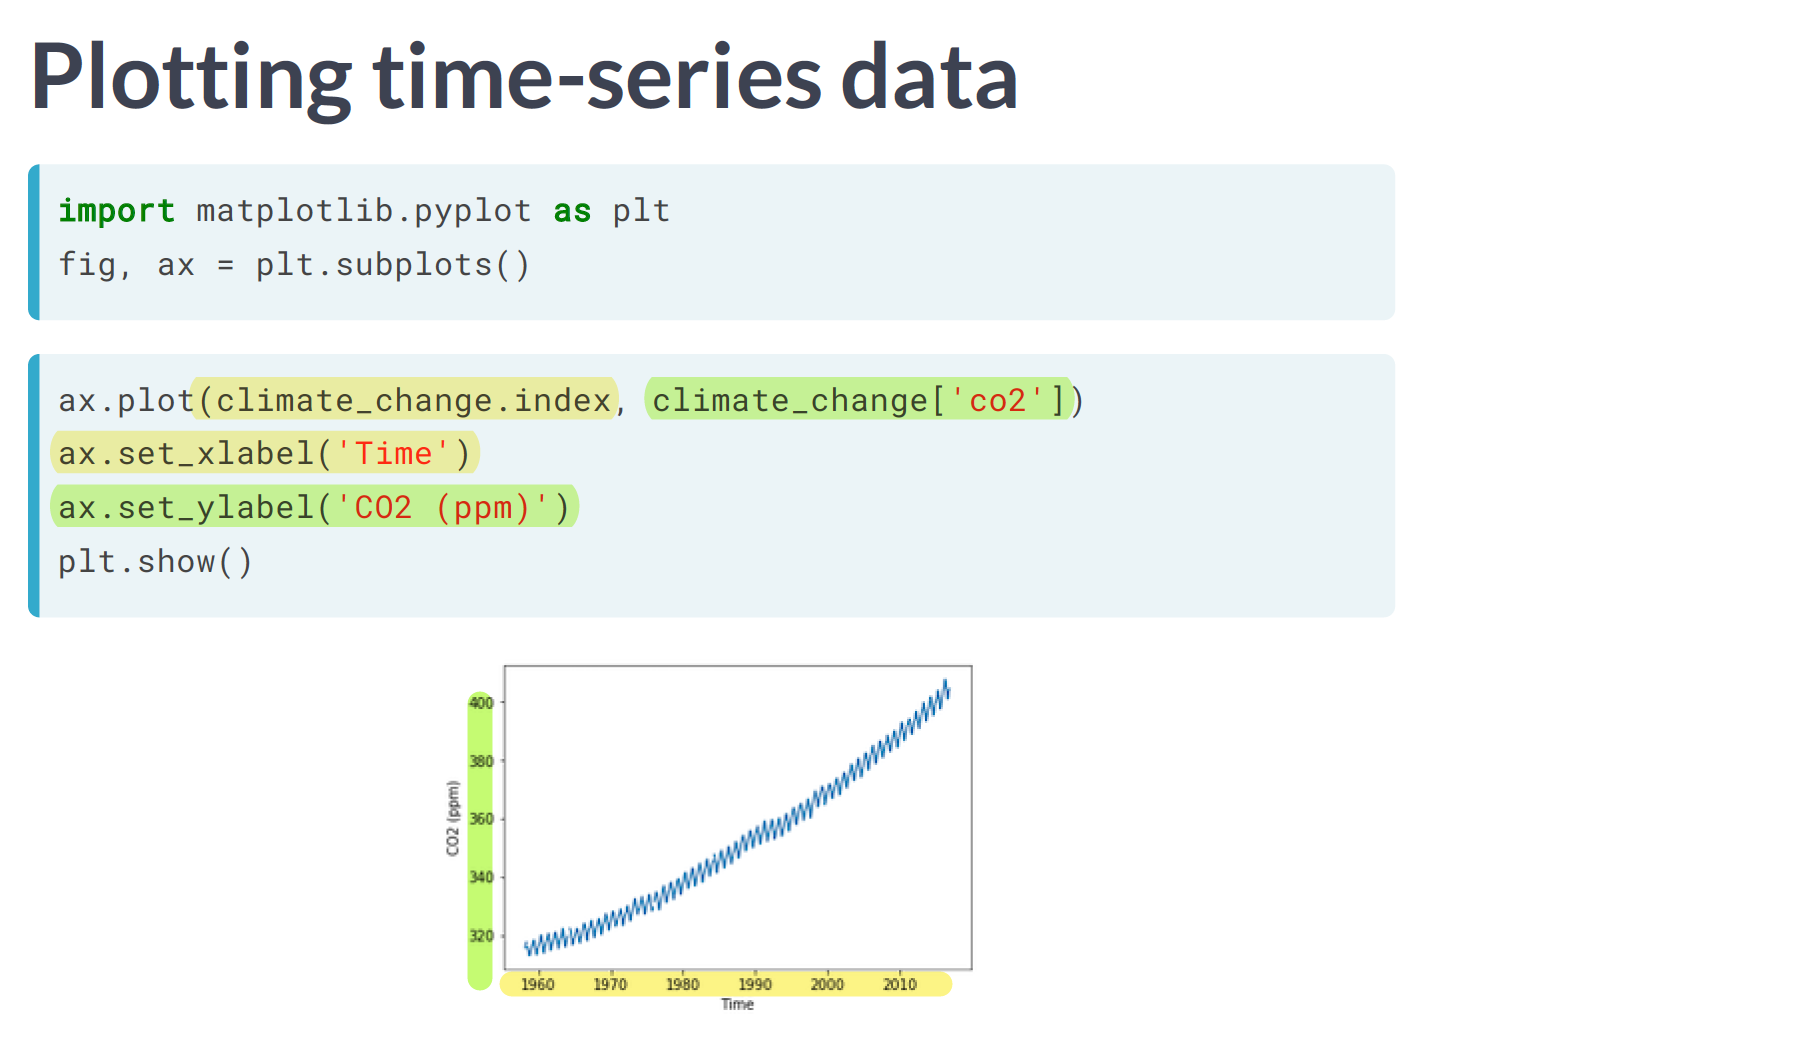
1. 시계열 데이터 시각화 (Plotting time-series data)
2. 시계열 상 서로 다른 변수 시각화 (Plotting time-series data with different variables)
3. 그래프의 특정 부분 강조하기 : 텍스트, 화살표 Annotating time-series data
📌 오늘의 목표 그래프!

📌시계열 데이터 Time series data


📌예제연습 : Read data with a time index
To designate the index as a DateTimeIndex, you will use the parse_dates and index_col key-word arguments both to parse this column as a variable that contains dates and also to designate it as the index for this DataFrame.
# Import pandas
import pandas as pd

# Read the data from file using read_csv
climate_change = pd.read_csv('climate_change.csv', parse_dates=["date"], index_col="date")
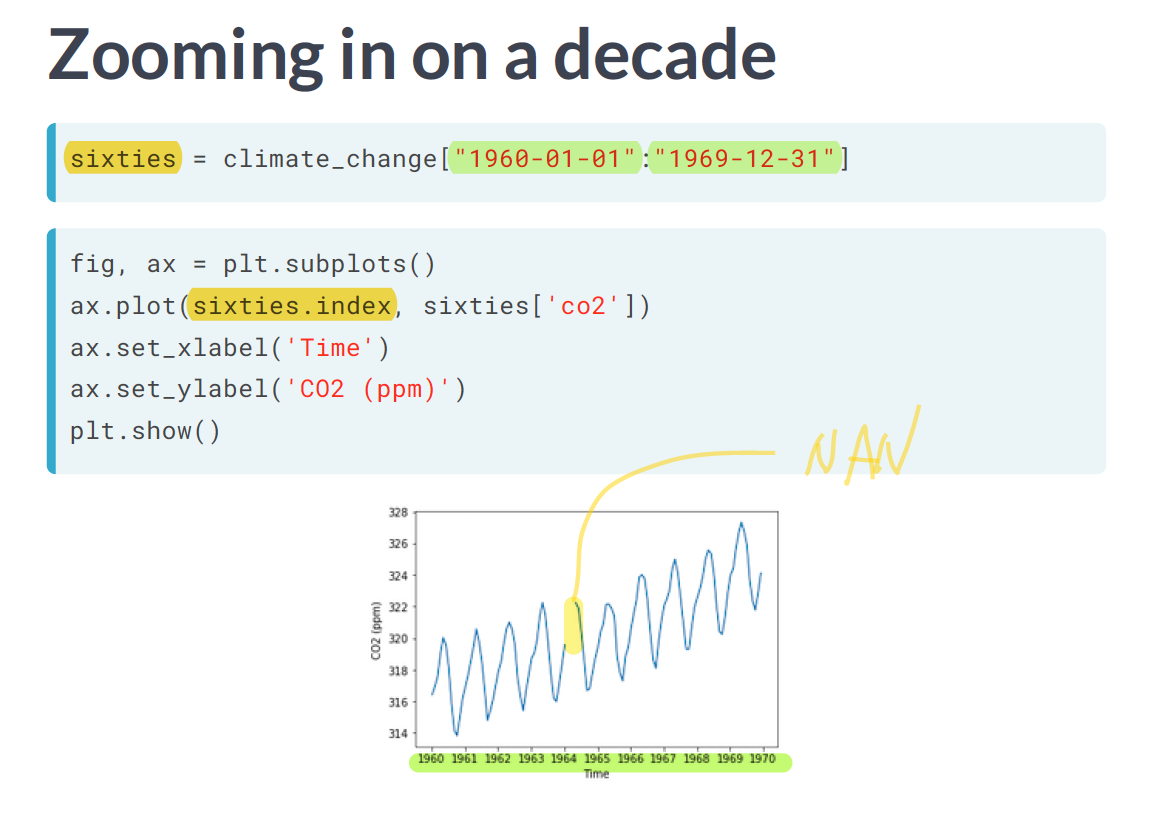
📌Zoom in


Plotting time-series with different variables
[Step1] 일단 합쳐보면, 뭔가 부족하다!

[Step2] .twinx() : 두 subplot이 x축을 공유한다
# Create a twin Axes that shares the x-axis
# x축을 공유하는 twin axes를 생성한다
ax2 = ax.twinx()

[Step3] color keyword arguement : 각 변수의 색을 지정

[Step4] .tick_params() 메서드로 Tick에 색을 설정

📌변수 2개 시각화 예제

import matplotlib.pyplot as plt

# Initalize a Figure and Axes
fig, ax = plt.subplots()

# Plot the CO2 variable in blue
ax.plot(climate_change.index, climate_change["co2"], color='blue')

# Create a twin Axes that shares the x-axis
ax2 = ax.twinx()

# Plot the relative temperature in red
ax2.plot(climate_change.index, climate_change["relative_temp"], color='red')

plt.show()
📌 함수 : 시계열 데이터를 시각화하는 함수 정의하기
# Define a function called plot_timeseries
def plot_timeseries(axes, x, y, color, xlabel, ylabel):

  # Plot the inputs x,y in the provided color
  axes.plot(x,y, color=color)

  # Set the x-axis label
  axes.set_xlabel(xlabel)

  # Set the y-axis label
  axes.set_ylabel(ylabel, color=color)

  # Set the colors tick params for y-axis
  axes.tick_params('y', colors=color)
📌Annotating time-series data


'Learning archive > Data Science' 카테고리의 다른 글
| 지역화폐 데이터 시각화 (0) | 2020.12.21 |
|---|---|
| 📊 R 기초 | 벡터 만들기, 네이밍, 벡터 연산, 특정 원소 선택하기 (0) | 2020.09.12 |
| 📊 Matplotlib 데이터 시각화 | 그래프 마커, 라인스타일, 컬러 지정 | Small multiples : 다수의 그래프 그리기 (0) | 2020.09.10 |
| 📊[DataCamp] .merge_ordered() | .merge_asof() | .melt() Course -Joining data with pandas- wrap up (0) | 2020.09.08 |
| 📊[DataCamp] Filtering join : semi-join, anti-join (0) | 2020.09.07 |